HRV - INGENIOUSLY SIMPLE!

More than software - a strong relationship with the patient.

Therapy options

There are many ways to treat autonomic imbalance, as the effectiveness of therapy can be checked and controlled at any time with ANS Analysis.

The therapeutic goal in regulatory disorder should be the restoration of vegetative / autonomic balance.

Some examples of therapies to improve autonomic regulation (including recommendations from users of the ANS Analysis)

  • Potassium
  • Coenzyme Q10
  • Biofeedback
  • Craniosacral therapy
  • Autogenic training
  • Neural therapy
  • Psychotherapy
  • Osteopathy
  • Sports/Exercise
  • Progressive muscle relaxation
  • Mindfulness Training
  • Autogenic Training – Yoga Meditation etc.

Terms & Methodology of ANS Analysis

Heart rate variability terms - HRV

There are several terms for autonomic nervous system analysis that clarify the underlying methodology:

  • Heart rhythm variability HRV
  • Heart rate variability HRV
  • Heart rate variability HRV
  • Heart Rate Variability HRV

…are different names for the measurement and evaluation of R-R intervals (time intervals from heartbeat to heartbeat) either by a chest strap (wireless) or ECG electrodes (wired).

Methodology of the ANS Analysis

The basis of the measurement is the recording of a technically flawless electrocardiogram in which the intervals between the individual R-waves can be recorded and processed cleanly and without interference. There are so-called short-term measurements of 5-10 minutes and long-term measurements recorded over 24 hours. The scientific standards for HRV measurement and evaluation were precisely defined by a commission of experts in 1996 and are now the basis for HRV analysis being included as a basic diagnostic in the evidence-based national health care guidelines.

The sequence of intervals can be analyzed by various mathematical-statistical methods. A distinction is made here:

  • Time domain parameter (time-domain)
  • Frequency-based parameters (frequency-domain)
  • non-linear parameters e.g. DFA – alpha1

In the following, we will focus on the measurement parameters that are relevant in practice, the time-domain paramaters and the non-linear parameters.

The frequency-based parameters are mainly used in studies, but have little relevance for practice.

Short-term or long-term HRV measurement?

With the analysis of the autonomic nervous system, one wants to record the activity of the autonomic nervous system and recognize how stress stresses the body.
You can tell within 15 minutes whether the parasympathetic nervous system is able to take up its function in a resting situation or whether the function is restricted.

But what if the patient is agitated or has had a stressful day?

The autonomic nervous system is a regulatory system that controls and regulates all our organs and organ systems depending on the situation at hand.

If the patient has had a stressful day or is highly agitated, this will result in increased sympathetic activity and decreased parasympathetic activity.
In practice, this means that I cannot make an exact statement as to whether the parasympathetic nervous system can still work sufficiently and how many reserves are still available with just a single measurement.

In the case of conspicuous measurement results with increased sympathetic and decreased parasympathetic nervous system, a second measurement should therefore follow directly with a predefined cycle breathing (integrated in the ANS Analysis Professional).

The tact breathing leads to the stimulation of the parasympathetic nervous system and thus clarifies its reserves.

The image above shows a striking measurement with increased sympathetic (red) and decreased parasympathetic (blue) with a marked improvement in autonomic regulation under tact breathing. More information about breath timing here.

Thus, within 15 minutes you can make a statement about the vegetative regulation and recognize whether it is short-term stress, example above, or whether the stress has already manifested itself, see examples below.

Definition & History

ANS Analysis measures the autonomic nervous system via heart rate variability (HRV).

The ANS Analysis shows simply, quickly and scientifically recognized worldwide how our autonomic nervous system (ANS) regulates and functions. The ANS with its two main nerves sympathetic and parasympathetic, also called vagus, is a higher-level control center in the body, which controls and regulates subordinate processes and all vital functions such as blood pressure, respiration, heart rate, immune, hormonal and digestive systems, energy supply, etc.

The logic of the ANS Analysis

"When a higher-level system controls and regulates lower-level systems, the functional state of the higher-level system is the most important diagnostic parameter."

Introduction ANS Analysis

The heart becomes the focus of the ANS Analysis. Since it is directly controlled by sympathetic and parasympathetic nervous systems through the conduction system, it serves as the organ of success in ANS Analysis to measure the autonomic nervous system.
As internal and external stimuli are registered and processed by the sympathetic and parasympathetic nervous systems, sensible reactions (regulation) follow in order to prepare the organism as best as possible for the current needs (e.g. acute danger = provision of energy).
A disturbance of the ANS with overactive sympathetic and hypoactive parasympathetic nervous system will physiologically and inevitably lead to altered excitation of the heart. This changes the heart rate variability (distance from heartbeat to heartbeat) accordingly and is therefore measurable!

The Chinese physician Wang Shu-he documented this in his writings “Mai Ching”/”The Knowledge of Pulse Diagnosis” (today a “pulse classic”). He wrote down a sentence that is often quoted in modern times:

"If the heartbeat becomes as regular as the woodpecker's knock or the drip of rain on the roof, the patient will die within four days."

Further milestones of the ANS Analysis / HRV Analysis

  • 1891-Muller shows smaller increase in HF to atropine in cardiac patients.
  • 1927 – Winterberg and Wenkelbach describe respiratory sinus arrhythmia.
  • 1965 – Hon and Lee describe changes in RR intervals in “fetal distress”.
  • 1972 – Hinkel et al. Show increased risk of cardiac death with reduced respiratory sensory arrhythmia.
  • 1978 – Wolf et al. describe relationship between HRV and infarct mortality
  • 1981 – (Akselrod et al. 1981) “Spectral analysis of HRV is significant as a noninvasive, quantitative measure of the functionality of cardiovascular regulatory circuits.
  • 1990 – HRV analysis finds its way into clinical cardiology and diabetology
  • 2000 – HRV becomes part of the risk stratification for sudden cardiac death.
  • 2007 – Commit GmbH is founded and develops the ANS Analysis
  • 2010 – HRV analysis is included in the program for national care guidelines in the field of neuropathy in adult-onset diabetes.
  • 2016 – The International Society for Autonomic Functional Diagnostics and Regulatory Medicine e.V., in short IGAF, is founded.

"The wise use of the autonomic system will one day constitute the main part of the medical art."

"To keep the vegetative, the balance of tension and relaxation, harmoniously in balance means: art of living."

HRV measurement parameters

Time-based, non-linear and frequency-based parameters

Time-based HRV parameters

RR: Distance between two heartbeats (R-points in the QRS complex / ECG). The abbreviation RR can lead to misunderstandings in German, as it can also mean blood pressure.

NN: distance between two heartbeats (normal to normal)

SDNN: Standard deviation of all NN intervals, the SDNN gives an average of the variability and consists of shares from the sympathetic and parasympathetic nervous system. The SDNN can also be referred to as total variability or total power. For the patient, it can be called the total energy of the regulatory system.

SDANN: standard deviation of the mean of the NN intervals in all five-minute periods of the entire recording, (higher values indicate increased parasympathetic activity).

SDANN-i: standard deviation of the mean normal NN interval for all five-minute intervals in a 24-hour recording, (higher values indicate increased parasympathetic activity).

r-MSSD: square root of the root mean square of the sum of all differences between adjacent NN intervals (higher values indicate increased parasympathetic activity).

SI: Stress index, reflects sympathetic activity.

pNN50: percentage of intervals with at least 50 ms deviation from the preceding interval (higher values indicate increased parasympathetic activity).

SDSD: Standard deviation of differences between adjacent NN intervals.

NN50: number of pairs of adjacent NN intervals differing more than 50 ms from each other in the whole recording, (higher values indicate increased parasympathetic activity).

There are many more HRV parameters. However, many of these parameters are redundant. In the ANS analysis, the main time domain parameters RMSSD (parasympathetic), SI (sympathetic) and SDNN (standard deviation) are calculated and displayed graphically. In addition, the important non-linear parameter Alpha 1 / DFA 1 value is calculated, which reflects the quality of regulation and the interaction of the individual control systems.

Non-linear HRV parameters

Alpha 1 or DFA 1: detrended fluctuation analysis.

The Alpha 1 value not only measures purely temporal changes in heart rate variability (HRV), but it measures the quality of regulation.
By examining the HRV signal for random and repetitive areas, it is thus possible to determine how the individual regulatory systems work together.

Optimally, the alpha 1 value would be 1.0. This states that in heart rate variability, 50% are random signals indicating rapid responsiveness and 50% of the signals consist of repetitive signals. This indicates a fundamental stability of the control systems.

Anything above 1.0 means more stability and is more likely to mean compensation processes in the individual control systems.

Anything less than 1.0 means a lot of randomness, and anything less than 0.8 indicates that the control systems are not working well together. This state can also be called chaos in the system.

An example of stability in the system is, for example, measurement under paced breathing. When a measurement is performed under a given breathing rate, a respiratory sinus arrhythmia occurs, which can be seen very nicely in the rhythmogram. The signal looks very uniform, which means there is more stability in the system. The control systems work very closely coupled to each other, there is the so-called coherence. Thus, under cycle breathing, the alpha 1 value inevitably increases. So this is not to be considered negatively but shows that the systems can enter into coherence.

Frequency-based HRV parameters

The pure RR intervals can be decomposed into their frequency components by the FFT (Fast Fourier Transform). Frequency components in the VLF, LF and HF ranges result from the signal. The total power is specified in TP (Total Power).

It has been shown that frequency-based HRV parameters (spectral analysis) are not well suited for practical use because they are very susceptible and parameters such as the VLF range cannot be adequately mapped in a short-term measurement. Therefore, we restrict ourselves to the time domain parameters that are valid for a short time measurement.

VLF – Very Low Frequency
Frequency range: 0.00 – 0.04Hz

LF – Low Frequency
Frequency range: 0.04 – 0.15Hz

HF – High Frequnecy
Frequency range: 0.15 – 0.4Hz

LF/HF Ratio

Evaluation of the measurement data

HRV parameters

Rhythmogram, histogram and scatter plot

The basis of our VNS analysis is the detection of 520 R-R intervals (depending on the pulse between 5 – 10 minutes) by a chest strap with a measurement resolution of 1ms. The patient is measured in the sitting position. It should have come to rest 10 minutes before, similar to the blood pressure measurement.
The transmission of data from the chest strap to the receiver is digital via radio. The subsequent graphical display and calculation of the main ANS parameters is performed fully automatically by the software.

The VNS analysis has been optimized for daily use in practice so that the physician, alternative practitioner or therapist can quickly and easily evaluate and interpret the measurement data.

The rhythmogram is the basis of the measurement of the autonomic nervous system. Here the heart rate variability is recorded.

In the rhythmogram, each individual time interval from heartbeat to heartbeat is recorded in milliseconds (RR interval) and connected with a line. A total of 520 RR intervals are recorded on the X-axis.
On the Y-axis the duration of the respective heartbeat is displayed.
The more different the individual RR intervals are during the measurement, the more variability can be seen in the ryhthmogram.

This variability is a sign of adaptability. It shows that the autonomic nervous system is able to adjust to internal and external stimuli. Here, the variable heartbeat is used to test whether the autonomic nervous system manages to change the heartbeat depending on the situation.
At rest, this is once the breathing (when inhaling, the heart beats faster, when exhaling, the heart beats slower). This respiratory-dependent variability is referred to as respiratory sinus arrhythmia. This is generated to a large extent by the autonomic nervous system, especially the parasympathetic nervous system.
In addition to breathing, there are other influencing factors in the resting state to which the autonomic nervous system adjusts the body, e.g. the digestive system works, we think about things, we raise our arm to scratch ourselves, we hear sounds. The autonomic nervous system has to adjust the body to all these situations.

The measurement is performed in the idle state. In this resting state, the rhythmogram should show a large variability, since variability is greatest at rest.
Why the variability is greatest at rest is well explained by a simple example:
Our heart does not give full throttle at rest in order to be efficient, but it will only beat as fast as it is necessary at the moment (e.g. a little faster when breathing in, or when you briefly raise your arm to scratch yourself). Afterwards, the heart will immediately start beating slower again to conserve energies.

Variability is a sign of energy-saving work and good adaptability!

The variability and very specifically the rapid changes from one heartbeat to the next are predominantly modulated by the parasympathetic nervous system (relaxation nerve, brake). The parasympathetic nervous system does reduce heart rate, lowers blood pressure, generally slows us down, but electrophysiologically the parasympathetic nervous system responds faster than the sympathetic nervous system.

This is again easy to understand with a simple example:

The brake on your car makes your car slower. But if you fully apply the brake in your car, you will immediately nod your head forward because it reacts very quickly.
When you put the pedal to the metal (assuming you’re not driving a sports car), you’re not pushed abruptly into the seats.

large variability = much parasympathetic nervous system
low variability = little parasympathetic nervous system

In the second rhythmogram you see almost no variability, it resembles a straight line. This means the heart gives full throttle to be efficient. In the autonomic nervous system, the sympathetic nervous system is predominantly at work and the parasympathetic nervous system is on the sidelines.

GOOD HEART RATE VARIABILITY

POOR HEART RATE VARIABILITY

The histogram is another form of representation of the recorded heart rate variability.

In the histogram, the measured RR intervals are divided into fixed time ranges, e.g. 900 ms – 950 ms, etc. The percentage frequency of the values in a time range is visible in the height of the bar. The more bars there are in the width, the more variable the heart beats, the better the autonomic nervous system can regulate.
On the other hand, if you have only one or two bars, it means that the measured RR intervals are almost identical. Accordingly, the heart gives full throttle to be efficient. It does not adapt to the individual.

The distribution should resemble a Gaussian distribution curve. Other distributions allow conclusions to be drawn about possible arrhythmias.

many bars = much parasympathetic nervous system
few bars = few parasympathetic nervous system

GOOD HEART RATE VARIABILITY

POOR HEART RATE VARIABILITY

The scatter plot, or pointcaré plot, is also another representation of heart rate variability.

A point in the coordinate system results from two adjacent RR intervals. The first value is plotted on the X axis and the second on the Y axis. Thus, these two values result in a point in the scatter plot.

The larger the scattering cloud, the more variable the heart beats, the better the autonomic nervous system can regulate.
A highly condensed cloud means that the heart always beats evenly and can no longer adjust individually. It gives full throttle.

Optimally, the scattering cloud resembles an ellipse. Other forms of the cloud allow conclusions to be drawn about possible rhythm disturbances.

large scatter cloud = much parasympathetic nervous system
small scattered cloud = little parasympathetic nervous system

ANS parameters

Pulse, alpha 1, SDNN, sympathetic and parasympathetic nervous system.

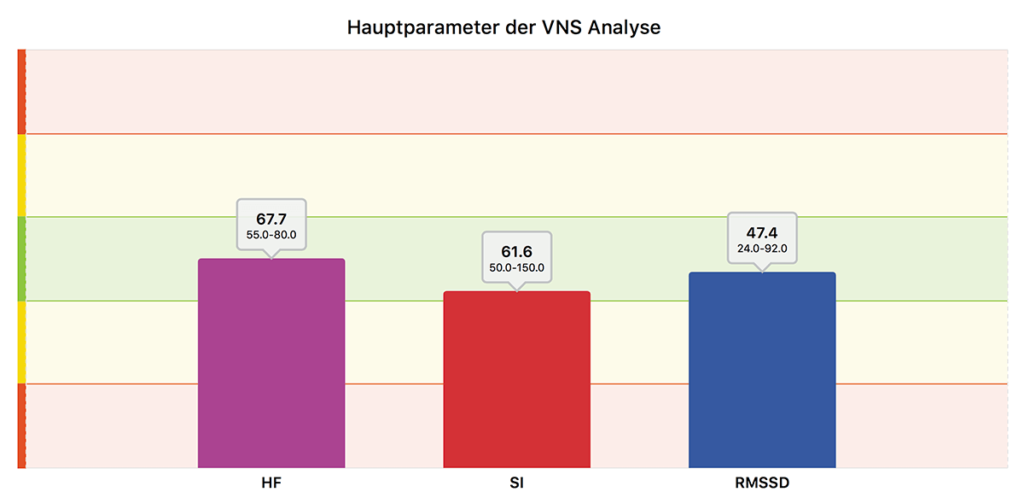
The VNS Analysis Professional includes two display options. By default, the simple patient display is shown. It includes the parameters resting pulse, body tension (sympathetic) and body relaxation (parasympathetic).

With one tap you can display the therapist view with the Alpha 1 value and the SDNN (see images and explanation below).

All parameters shown are mathematically calculated using heart rate variability. These mathematical formulas were standardized worldwide by a tasc force in 1996.

GOOD VEGETATIVE REGULATION - PATIENT VIEW

POOR VEGETATIVE REGULATION - PATIENT VIEW

The traffic light colors in the background are highlighted with norm values from worldwide literature. All parameters should therefore be in the green normal range at best.
The values above the bars are the measured values during the measurement. The values in parentheses indicate the normal range.

With the patient, one usually discusses the red and blue bars, as these two reflect the main nerves of the autonomic nervous system.

At a glance, you can say: Everything is in the green.
or: There is a need for action.

GOOD VEGETATIVE REGULATION - THERAPIST VIEW

BAD VEGETATIVE REGULATION - THERAPIST VIEW

The therapist view adds two more parameters to the patient view.
Once the Alpha 1 value and secondly the SDNN.

The Alpha 1 value is an additional risk parameter and indicates the quality of regulation. It should be in the green range at best. The higher it rises, the more compensation processes take place in the body.
The lower it falls, the more chaos there is in the system, indicating a breakdown of the control systems.

Most attention should be paid to alpha 1 when you have an elevated sympathetic nervous system and a depressed parasympathetic nervous system. When Alpha 1 is elevated, it shows the therapist that the body is already compensating and it is a matter of time how long the body will withstand this misregulation.

When alpha 1 is decreased with a dysbalance in the autonomic nervous system toward tension, many studies show that this poses an increased risk to the heart. The control systems can no longer work well together, there is chaos in the system and significantly increased risk.

high alpha 1 = compensation
lower alpha 1 = chaos

The SDNN is the standard deviation, or total variability. The higher the SDNN increases, the greater the variability, the better the adaptability of the autonomic nervous system.
The lower the SDNN, the lower the variability and thus the more limited the vegetative regulation.

high SDNN = much parasympathetic nervous system
low SDNN = low parasympathetic nervous system

ANS Example Measurements

Good regulation

With the patient, one usually discusses only the simplified patient view (3 bar display).

You can tell at a glance that all parameters are in the green zone.

Explain to the patient that we have measured the autonomic nervous system. The autonomic nervous system consists of two main nerves that control and regulate our entire body. Once the sympathetic nerve, the tension nerve, and once the parasympathetic nerve, the relaxation nerve.
These two nerves control our heartbeat, blood pressure, hormonal and immune systems, digestive activity, sexual organs, muscle tone, etc.

In this patient there is a balance of autonomic regulation.

You can see such evaluations in patients:

– who feel stressed, but the stress has not yet manifested itself physically
– Who perform sports and relaxation exercises for balance
– who do not have stress
– whose high blood pressure is well controlled by medication
– …

Very limited regulation

Regulation rigidity

With the patient, one usually discusses only the simplified patient view (3 bar display).

You can see at a glance that there is a massive imbalance between the sympathetic nervous system (red bar) and the parasympathetic nervous system (blue bar).

Explain to the patient that we have measured the autonomic nervous system. The autonomic nervous system consists of two main nerves that control and regulate our entire body. Once the sympathetic nerve, the tension nerve, and once the parasympathetic nerve, the relaxation nerve.
These two nerves control our heartbeat, blood pressure, hormonal and immune systems, digestive activity, sexual organs, muscle tone, etc.

This patient has a massive imbalance of autonomic regulation with a hyperactive sympathetic nervous system and a hypoactive parasympathetic nervous system.

You can see such evaluations in patients:

– with advanced chronic diseases
– with high stress levels
– With burnout

Measurement before and after breath timing

In the first measurement, you can see that the sympathetic nervous system is too high and the parasympathetic nervous system is too low.
The SDNN is also slightly limited, the Alpha 1 is still in the green zone.

In practice, it is generally handled in such a way that the assistant performs the measurement. She then sees that the red bar is higher than the blue bar and explains to the patient that a second measurement will now take place directly afterwards.

In the ANS Analysis Professional is integrated respiratory therapy, which directly stimulates the parasympathetic nervous system. This simply tells the patient when to breathe in and when to breathe out, see the ANS Analysis Professional video for more information.

The helper explains to the patient that this stimulates the relaxation nerve, and thus it is possible to see how much reserve it still has.

In this example, by comparing the bars directly, you can see that the sympathetic nervous system is significantly reduced and the parasympathetic nervous system more than doubles from 10.6 to 22.6.

Although the parasympathetic nervous system does not quite come into the green zone yet, it is quickly recognized that this patient is still capable of regulation and that simple regulative therapies should have an effect relatively quickly.

If the patient has no symptoms and complains only of stress, he can be offered respiratory therapy with the Vagusvit respiratory trainer as a therapy. For existing diseases, respiratory therapy should be used as an adjunctive therapy.

If no or only little improvement can be achieved by timed breathing, one can assume that this condition is relatively manifest and one should try to lift this regulatory rigidity again.

In the rhythmogram you can see that the variability adapts exactly to the breathing. Respiratory sinus arrhythmia occurs, which is significantly modulated by the parasympathetic nervous system. This means that if respiratory sinus arrhythmia is seen, it means that the parasympathetic nervous system can still take up its function.

In the parameter plot, you can also see that the SDNN increases because the variability increases.

The alpha 1 value should increase under breath pacing because coherence is created in the systems via breath pacing. Since the alpha 1 is calculated using the structure in the signal and there is uniformity in clock breathing, the value increases. There is more stability, which you can see in a very smooth up and down movement in the measurement. There are no random signals to be seen there, reminiscent of chaos.

Measurement with required correction

During this measurement, the ANS Analysis automatically tells you that abnormal values have been recorded and it is recommended to activate the correction.

During the first measurement you will see very clearly a small peak in the rhythmogram.
Since the ANS parameters, especially the parasympathetic nervous system is measured based on the variability from one heartbeat to the next, they are positively biased in this case.
The Alpha 1 is distorted downward by rhythm disturbances and artifacts, since these occur chaotically.

After the automatic correction you will see that the peak has disappeared and the parameters have changed.

Therefore, it is important to look at the record of the data.

Up to 10% technical artifacts and/or rhythm disturbances can be filtered out fully automatically.
If the error rate is above 10%, the ANS Analysis will show you a permanent indication of the increased number of artifacts/arrhythmias, as an evaluation is no longer recommended for values with more than 10% errors.

Higher degree of arrhythmia

Measurement not evaluable

In this measurement you can see extreme variability in the rhythmogram, bars that fill the whole field of the histogram and a huge scattering cloud that does not resemble an ellipse.

In the ANS parameters, you see a parasympathetic nervous system that is at the top of the red zone.
Such extreme values are usually not physiological.

The alpha 1 is 0.1, which is almost non-existent pyhsiologically and is therefore an indicator of possible arrhythmias. These occur completely chaotically, without structure, and thus lower the alpha 1 value.

An ECG should generally be written for such abnormal values.

These are higher-grade arrhythmias in which filtering is no longer possible, since every second beat is an extrasystole. This measurement cannot be evaluated.
The ANS Analysis therefore gives you an indication that the measurement is conspicuous and should be checked again in detail.

X